Understanding your dashboard
Dashboard overview
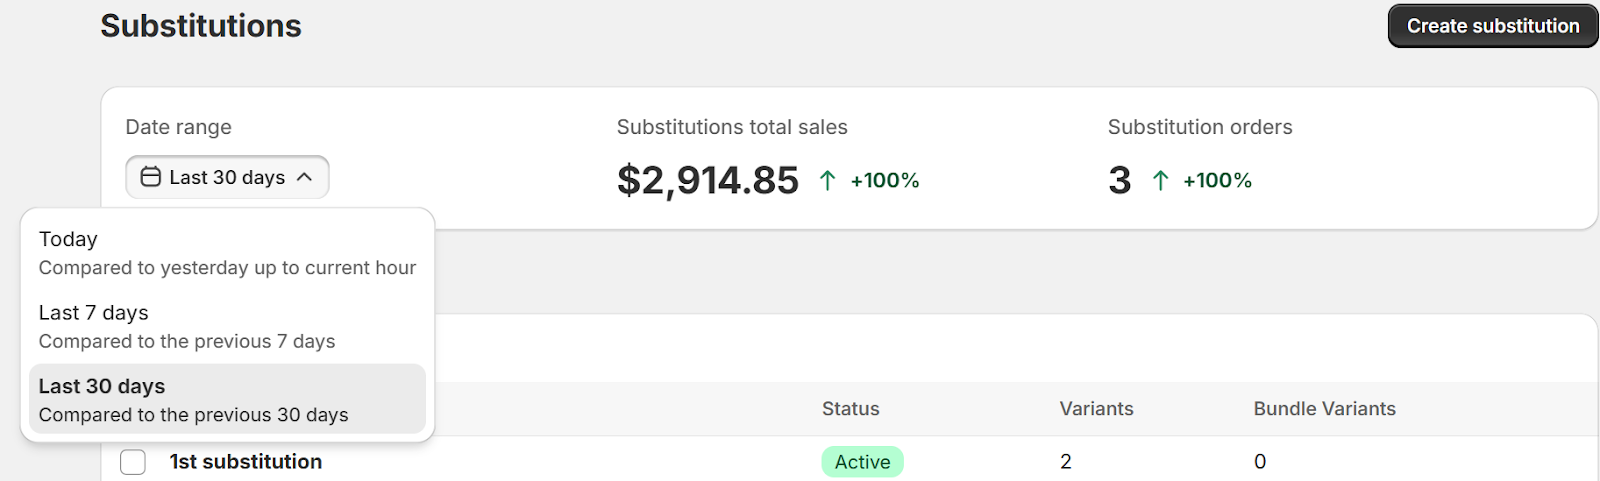
Your dashboard shows how substitutions are performing across your store and gives you quick access to manage your rules.
Summary bar
At the top, you'll see key metrics:
Substitution total sales — Revenue from orders that included a substitution
Substitution orders — Number of orders where at least one item was substituted
Performance change — Comparison to the previous period of equal length
Date ranges
Use the date picker to switch between:
Today
Last 7 days
Last 30 days
Metrics update automatically when you change the range.
Performance indicators
Green arrow → Increase from previous period
Red arrow → Decrease from previous period
Grey arrow → No change
Substitution list
Below the summary bar, you'll see all your substitution rules. From here you can:
Filter by Active, Inactive, or All
Click any rule to view or edit it
Create a new substitution
Select one or more rules to deactivate or delete in bulk
New to the app?
If you haven't had any substitutions trigger yet, your metrics will show zero—that's normal. Once orders start flowing and substitutions activate, your dashboard will populate automatically.